How it Works
Something's off in your facility. Let's find out what.
Maybe it's a hot spot that shouldn't exist. Maybe the BMS says you're fine but the equipment disagrees.
Maybe you need to prove your cooling works before you make a big change.
Whatever it is — we find it. Fast, at the rack level, with data you can actually use.
The Problem With "Everything Looks Fine"
Your BMS isn't lying. It's just not close enough to the rack.
Room averages hide localized problems. Permanent sensors miss blind spots. And by the time an alarm fires, the damage is already in progress.
Rack-level field data tells a different story — and that's the only story that matters when something's wrong.
Three steps from first conversation to clear action plan.
Discovery Free · 30 min
We start with a short conversation. You tell us what's happening. We identify the right scope. No homework for you — just 20 minutes and a clear next step.
AUDIT-BUDDY™ Deployment
Your team or ours. Sensors go across your facility. We capture rack-level data in live, operational conditions — no downtime required.
Analysis & Report
Know what to fix. Know what can wait. Heat maps, trend analysis, and a prioritized findings list. Not a data dump — a roadmap.
Stop guessing and start measuring
Whether you run it yourself or bring our team on-site, AUDIT-BUDDY™ captures temperature, humidity, airflow, and delta-T at every rack. Our software turns that raw data into heat maps, trend analysis, and a prioritized list of exactly what to fix.
See What’s Happening

See exactly where cold air is going — and where it isn't.
Know what to fix first

Know what's critical, what can wait, and what to watch.
Validate before something fails

Prove it's working — before something tells you it isn't.
What's Happening in Your Facility?
Pick the situation that sounds most like yours.
Scenario 1Something seems off and I need to know what's happening right now.
You've got a hot spot. An alarm that cleared before anyone arrived. A recent equipment change and a nagging feeling something shifted. You don't need a six-month study — you need an answer.
What you get: Rack-level temperature and humidity maps of the problem area. A plain-English findings summary. A one-page memo you can hand to your manager.
Typical turnaround: Deliverables within 3 business days of on-site work.
This keeps happening and I can't figure out why.
You've looked. You've adjusted. The problem comes back. It only shows up at certain loads, certain times of day, or after something changes — and you can't catch it in the act.
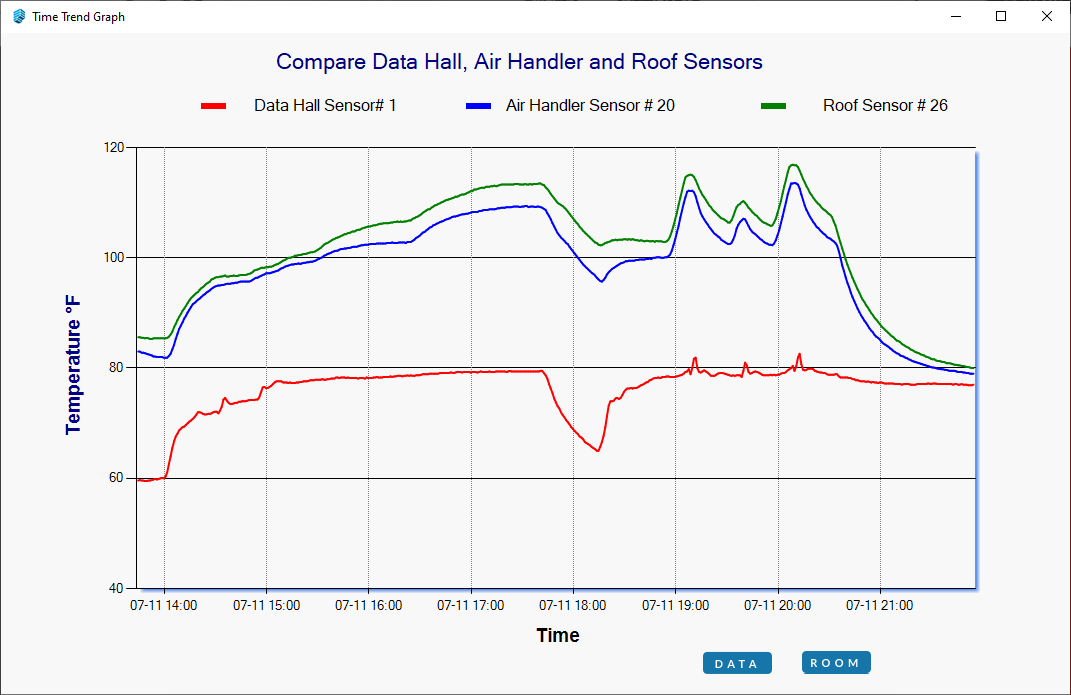
What you get: Extended monitoring over a full operational cycle. Time-trend graphs. Dynamic heat maps. A root cause hypothesis backed by data, not guesswork.
Typical turnaround: Deliverables within 5 business days of data collection.
Scenario 3I need to prove my cooling works — before something goes wrong
You're commissioning a new facility. Validating a CFD model. Preparing for a density increase or a setpoint change. You need independent, rack-level proof — not a theory, not a dashboard screenshot.
What you get: Multi-scenario validation. Full deliverable set. Board-ready executive summary. Independent data you didn't generate yourself.
Typical turnaround: Deliverables within 7–10 business days of on-site completion.
This sounds like your situation? →
Scenario 2From raw data to a clear action plan
— in days, not months.
What You Get
Every assessment produces a complete picture of your facility's thermal performance. Not averages. Not estimates. Rack-level data that shows exactly where your airflow is working, where it isn't, and what to do about it.
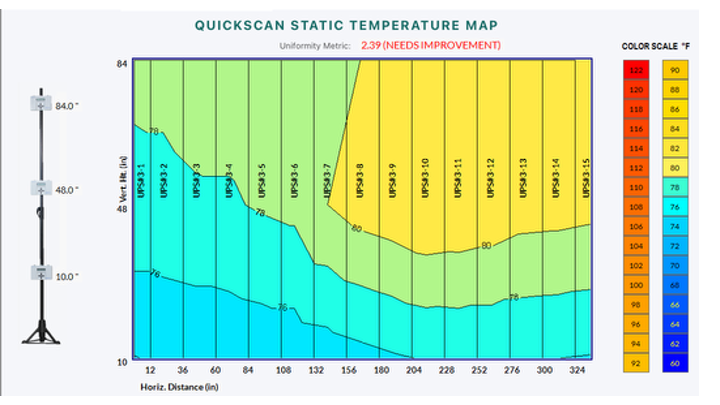
Heat Maps
See exactly where cold air is going and where it isn't. Bypass zones, hot aisles, and under performing racks are immediately visible — no interpretation required.
Trend Analysis
Track how temperatures behave over time. Spot patterns that point-in-time snapshots miss entirely.
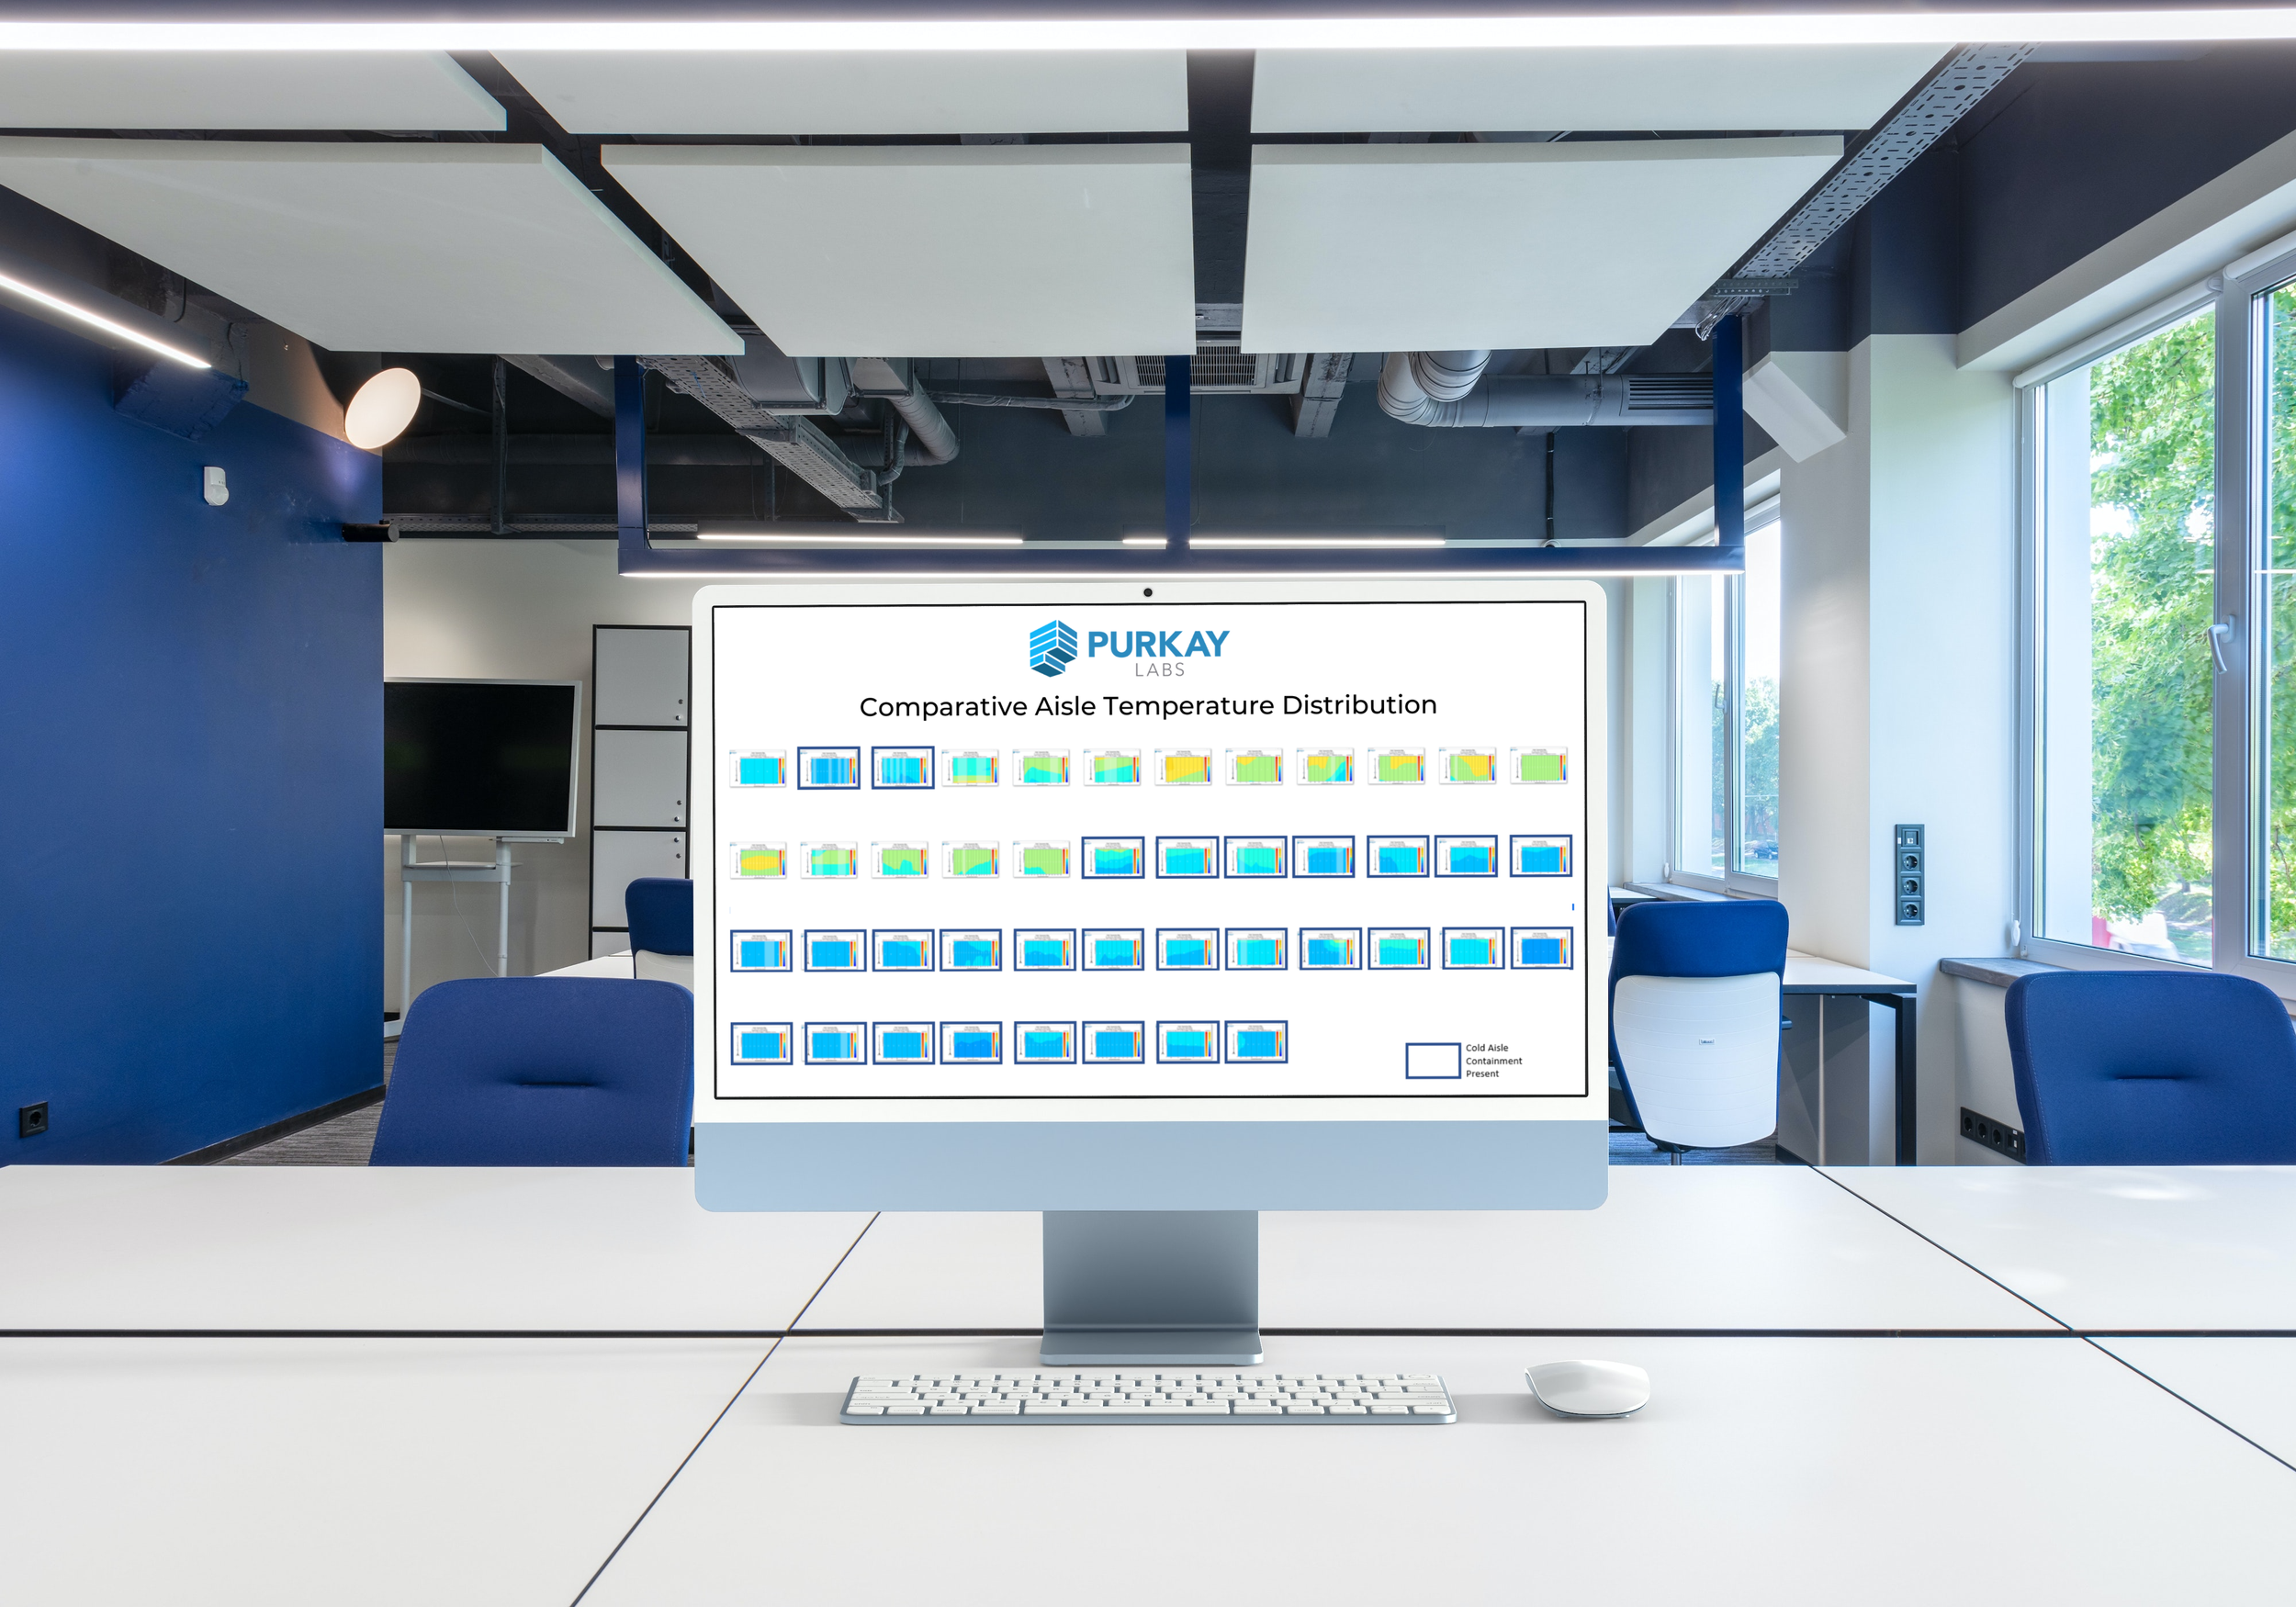
Uniformity Metrics
Measure how consistently cold air is distributed across your facility. Know where you have margin — and where you don't.
Prioritized Recommendations
Every finding is ranked. Your team knows what's critical, what can be scheduled, and what to monitor.
See all data here.
| Self-Directed | On-Site Assessment | |
|---|---|---|
| Who runs it | Your team | Purkay Labs team |
| Hardware | AUDIT-BUDDY™ shipped to you | We bring everything |
| Deployment | You place and run the hardware | We handle setup and data collection |
| Analysis & Report | Included | Included |
| Best for | Teams with capacity to run it internally | Teams that want it handled end to end |
| Timeline | Flexible — run on your schedule | 1–7 days on-site depending on scope |
| First step | Purchase or rent AUDIT-BUDDY™ | Book a pre-assessment call |
Want to explore the two options ? Contact us to learn more.
How We Work Together
Your team or ours — same data either way.
Two ways to run an assessment. The right choice depends on your team's capacity and how hands-on you want to be.
Case Studies
What operators find when they actually look.
60 tons of excess cooling freed up. $10K saved in month one. A major CRAC design flaw caught before a Fortune 25 bank went live.
Here's what rack-level visibility actually uncovers.


See all case studies here.
FAQs
What is a thermal assessment?
1
A thermal assessment is a short, targeted study of temperature, airflow, and humidity inside your data center. We measure conditions at the rack level to understand how your cooling system is actually performing—beyond what design documents or high-level sensors suggest.
How long does a thermal assessment take?
2
Most projects run 1 to 7 days on site, depending on facility size, scope, and objectives. We focus on getting useful insight quickly, without disrupting operations.
What kinds of facilities do you work in?
3
We work across enterprise and corporate data centers, colocation facilities, legacy sites with evolving layouts, and hyperscale and high-density environments. New builds and decades-old facilities both benefit — often for different reasons.
Do we need to shut anything down or disrupt operations?
4
No. Our assessments are designed for live, operational environments. We work around production systems and coordinate closely with your team to minimize disruption.
What do we actually receive at the end of the project?
5
You’ll receive: Clear heat maps and trend data
Identification of thermal constraints and risk areas
Practical, prioritized recommendations
The goal is clarity—your team should know what to fix, what to monitor, and what’s working well.
What if we already suspect where the problem is?
6
That’s common—and useful.
We can target known pain points to confirm root causes, rule out false assumptions, or uncover contributing issues nearby.
How much does a thermal assessment cost?
7
Pricing depends on facility size, scope, and duration.
After a short scoping call, we provide a clear proposal—no surprise add-ons, no open-ended engagements.
Next Steps
Ready for a Free Action Plan?
Tell us what's happening and we'll respond within 48 hours.
Not sure where to start
Answer 6 questions and get a customized cooling risk report — free, no email required to start.
A colo provider suspected a tenant was drawing too much cooling. Assessment proved the opposite — the tenant was significantly overcooling. SLA dispute resolved with data, not assumptions.