Dynamic Maps
When you need to see the changes in your environment, try the Dynamic Heat Map.
What is a Dynamic Heat Map?
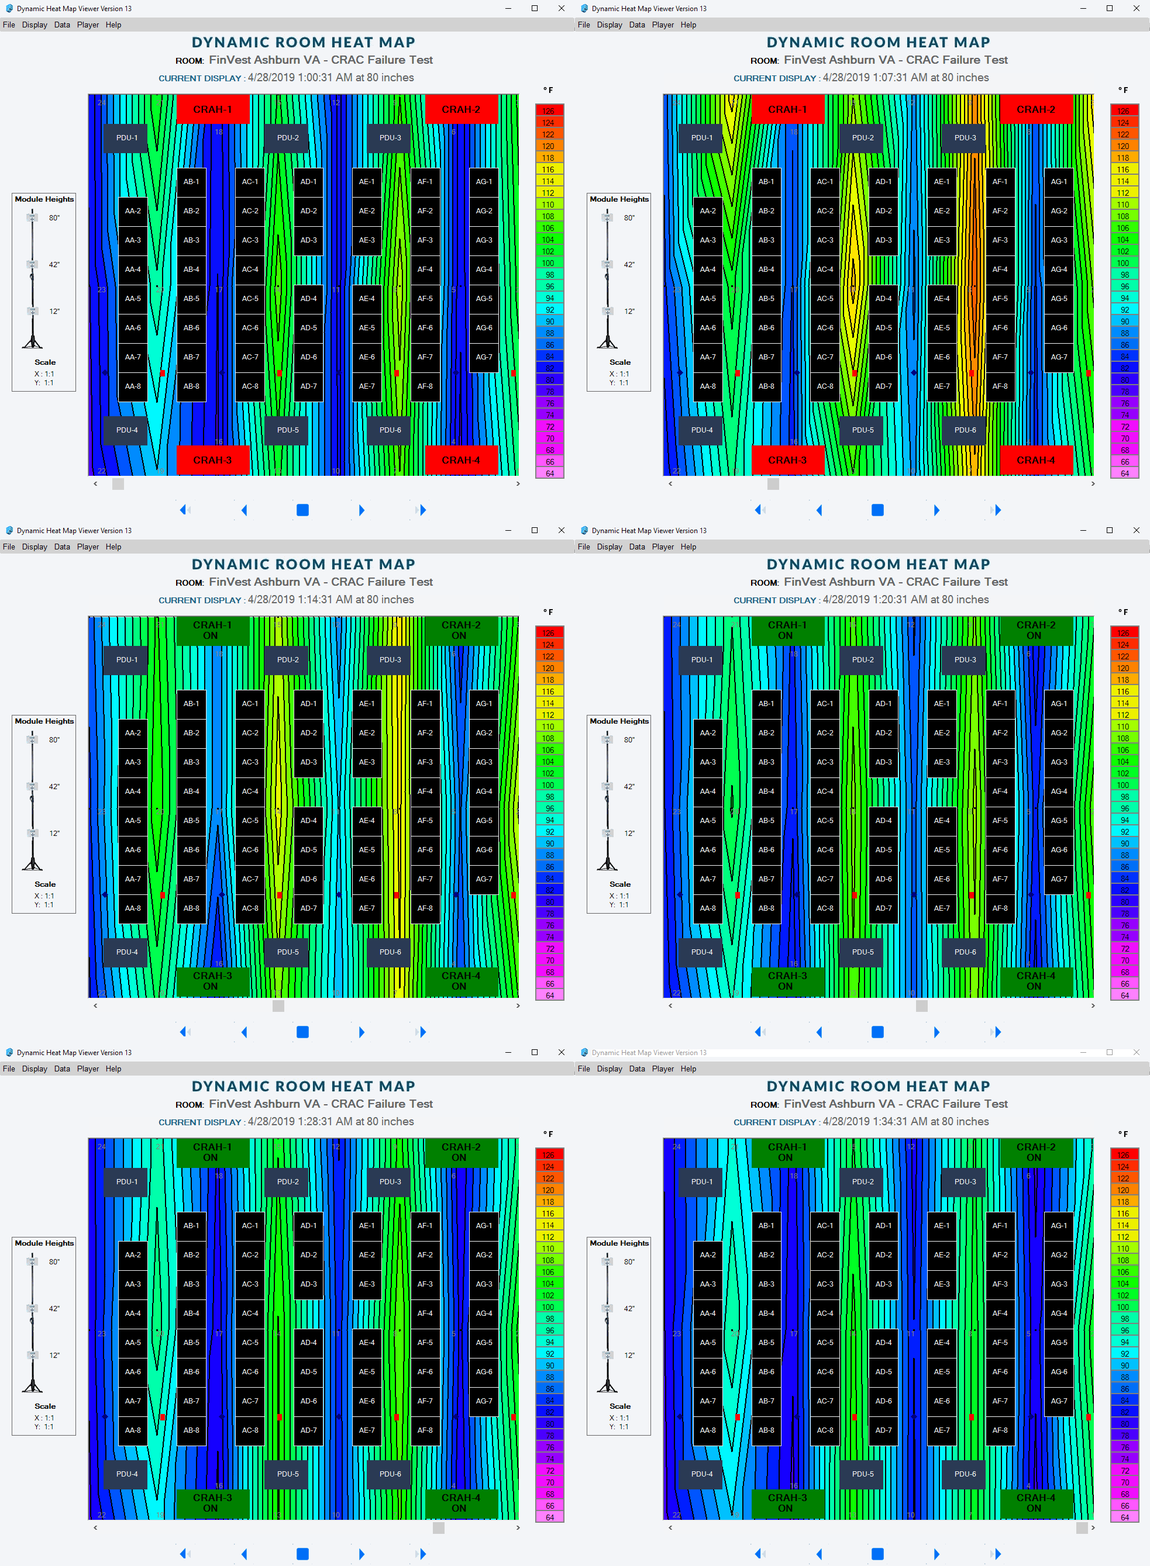
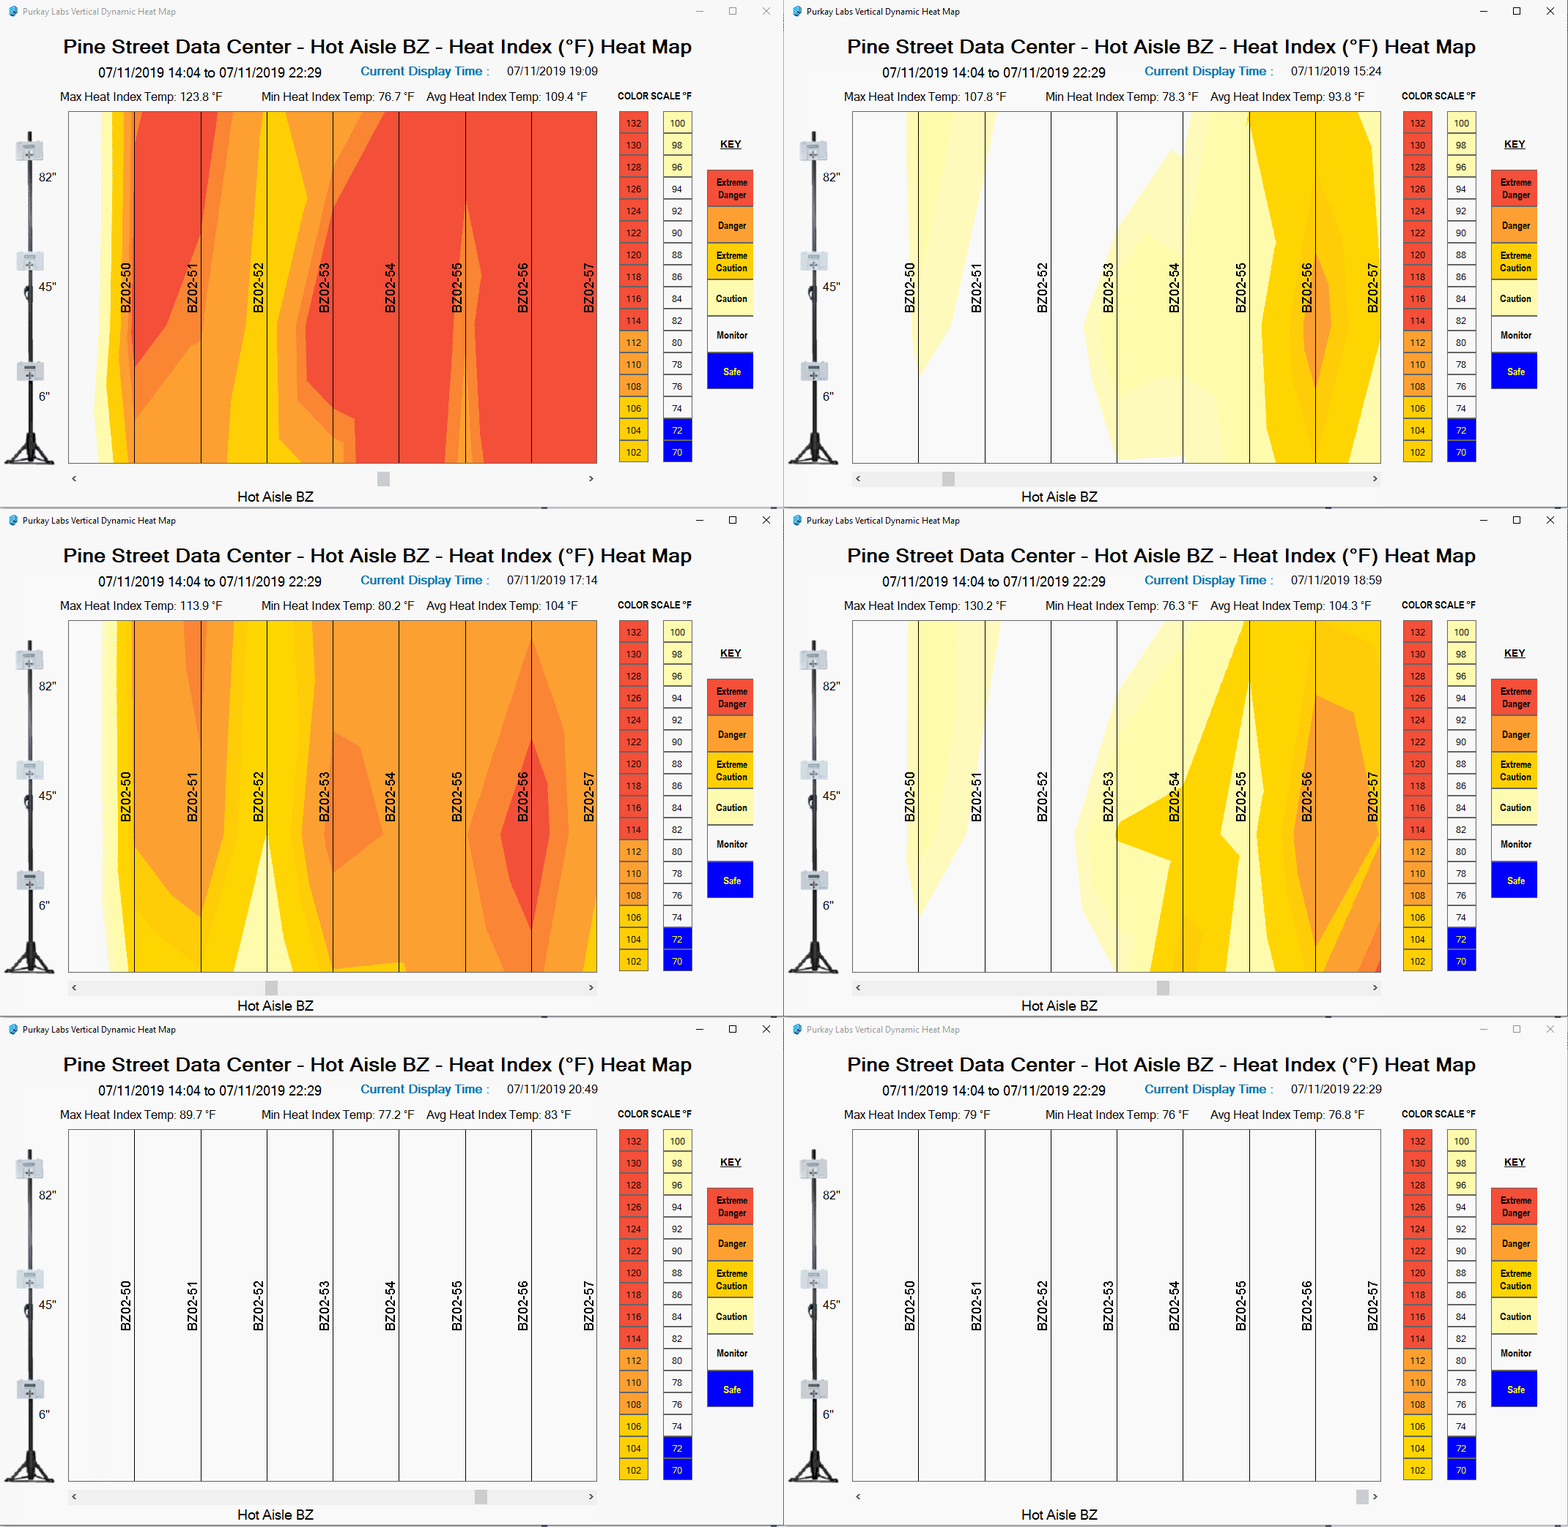
A dynamic heat map is a visual representation of environmental data collected at three different heights across multiple locations over time. This data is stitched together to create a comprehensive view of the variations in a given space. Each map visually shows the changing climate conditions over time in either a .mp4 or .gif format.
How Do You Create a Dynamic Heat Map?
Place multiple AUDIT-BUDDYs across the target area and use the LongScan mode to collect data at multiple heights. You can either purchase or rent the stands, or use the Purkay Labs’ Thermal Survey service. Once the data is collected, you will need to work with Purkay Labs to generate the dynamic heat maps.
Example Set up of Multiple Stands Collecting LongScan Data
Example Dynamic Heat Map of a Hot Aisle
What Do You Need to Create Dynamic Heat Map?
Rent multiple AUDIT-BUDDY Stands or use Purkay Labs’ Thermal Survey Service
AUDIT-MATE Software
Stand Tags
Dedicated PC & Tablet
What Types of Dynamic Maps Are There?
Type 1 - Vertical or Horizontal
First select if you need a vertical plane (as if you are facing the area) or a horizontal plane (to create a birds eye view").
Type 2 - By Data Type
Then select the type of data you’d like to display - temperature, humidity, dew point, delta-T, heat stress or WGBT.
Dynamic Temperature Map
Dynamic WGBT Map
Dynamic Relative Humidity Map
Dynamic Heat Stress Map
Dynamic Dew Point
Map
Features
Track environmental changes over time
Profile View of An Area
Quickly synthesize data from multiple locations at multiple heights
Benefits
Quickly Find Hot Spots
Because the Dynamic Heat Map uses trend data you can easily see where your hot spots are, when they occur, and how long they last. You can also determine if it’s safe enough to raise your inlet temperatures, which will save on cooling.
No More Models
Now you don’t have to rely on models to predict what might happen. Instead you can see in real time where the problems are. The Dynamic Heat Map shows how your room is actually behaving over a period of time, so you react quickly to real-life problems immediately. The Dynamic Heat Map takes complex environmental trend data and makes it easy to digest in a single glance.
Use Anywhere
While the Dynamic Heat Map was originally created for a Commissioning application, it can be utilized anywhere you need to visualize airflow: Retro-Commissioning, Office Buildings, Trading Floors, Labs, Schools.
FAQs
What is the Dynamic Heat Map?
The Dynamic Heat Map takes AUDIT-BUDDY data from multiple stands to stitches it together in a horizontal (plan/birds eye) or vertical (profile) view. The result is the viewer is able to see the environmental changes over time.
What information do I get?
Each Dynamic Heat Map program is custom-designed for each facility. It can include trend graphs for CRAC Stress Tests to custom built airflow analysis.
What is the price?
The price depends on the size of the room or object, and the level of information fidelity. Please contact us for a customized quote.
Can I create the Heat Map Myself?
Currently you must work with Purkay Labs to create the Dynamic Heat Map. You can use your own staff to collect the raw data and then send it to to Purkay Labs to be converted into a Data Hall Program.
Is this a CFD?
The Dynamic Heat Map uses real data, collected with our AUDIT-BUDDY systems. It is a great way to validate a CFD that simulates room conditions.
Is the Dynamic Heat Map just for data halls?
You can create a Dynamic Heat Map of any room or object. Simply rent the AUDIT-BUDDY stands, place in the desired location, collect data and Purkay Labs will generate the Dynamic Heat Map for you.


